JAXAがGEE apiみたいにデータ分析できるツールを公開したので使ってみた。
インストール
Getting Started — JAXA Earth API for Python (Prototype) 0.1.0 (Prototype) documentationより、jaxa-earth-0.1.0.zipをダウンロードします。ダウンロードしたzipファイルを格納したフォルダで以下を実行します。
$ pip install .\jaxa-earth-0.1.0.zip
Successfully built jaxa-earth
Installing collected packages: urllib3, idna, charset-normalizer, requests, jaxa-earth
Successfully installed charset-normalizer-2.0.12 idna-3.3 jaxa-earth-0.1.0 requests-2.28.0 urllib3-1.26.9
と表示されればモジュールのインストール完了です。 matplotlibとrequestsが同時にインストールされます。
単一データを表示
dataset、日付を指定しない場合、AW3Dの全球が表示される仕組みになっているようです。 実行時に、numpyやmatplotlibのモジュールは不要です。
# Load module
from jaxa.earth import je

# Get an image
data = je.ImageCollection(ssl_verify=True)\
         .filter_date()\
         .filter_resolution()\
         .filter_bounds()\
         .select()\
         .get_images()

# Process and show an image
img = je.ImageProcess(data)\
        .show_images()

AquaのLSTを表示してみる
提供している、表示できるDatasetにMODIS、Aquaがあるようです。 Datasetを指定するキーワードには、DatasetIDを指定することができます。filter_resolutionは緯度1度あたりに何ピクセルの分解能で表示するかを指定します。MODIS、Aquaのデータであれば、100以上指定して大丈夫なはず。 filter_resolutionで大きい値を指定すると、ピクセル値の上限値に達してエラーになります。
# Load module
from jaxa.earth import je

# Set query parameters
kw   = ["Aqua","LST","half-monthly"]
dlim = ["2021-01-01T00:00:00","2021-01-01T00:00:00"]
ppu  = 5
bbox = [110, 20, 160, 50]

# Get information of collections,bands
collections,bands = je.ImageCollectionList(ssl_verify=True)\
                      .filter_name(keywords=kw)

# Get an image
data = je.ImageCollection(collection=collections[0],ssl_verify=True)\
         .filter_date(dlim=dlim)\
         .filter_resolution(ppu=ppu)\
         .filter_bounds(bbox=bbox)\
         .select(band=bands[0][0])\
         .get_images()

# Process and show an image
img = je.ImageProcess(data)\
        .show_images()
データを合成をしてみる (Composite)
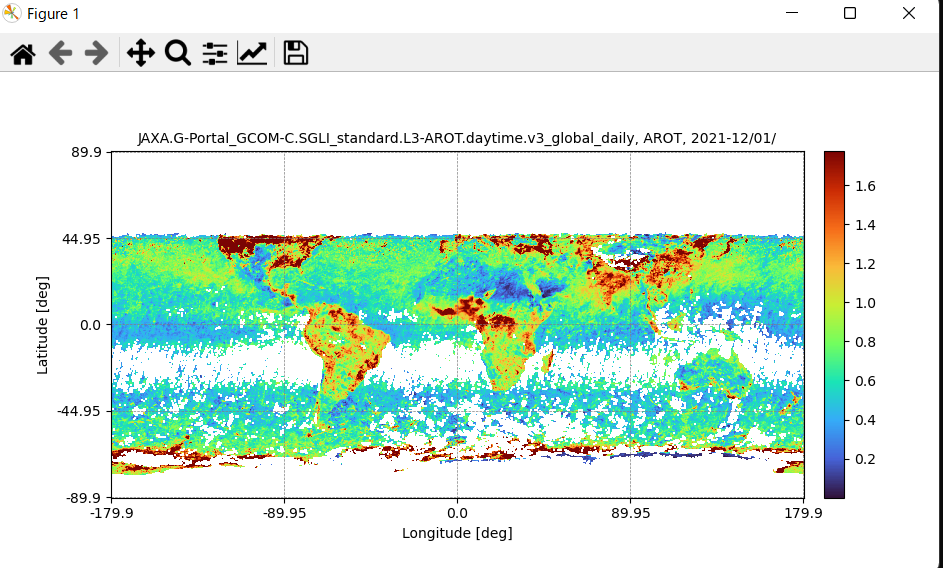
GCOM-Cのエアロゾルの光学的厚さのデータを一か月分合成(Composite)してみます。 GCOM-Cのデータは2021年12月分のデータしか配布されていないようです。 今回は、全球、filter_resolution=5 px、calc_temporal_stats にmaxを指定してみました。
結果出力は早かったです。
# Load module
from jaxa.earth import je

# Set query parameters
#kw_d = ["SMC","_daily"]
kw_d   = ["JAXA.G-Portal_GCOM-C.SGLI_standard.L3-AROT.daytime.v3_global_daily"]
dlim = ["2021-12-01T00:00:00","2021-12-31T00:00:00"]
ppu=5

# Get information of collections,bands for data
collections,bands = je.ImageCollectionList(ssl_verify=True).filter_name(keywords=kw_d)

# Get an image for data
data = je.ImageCollection(collection=collections[0],ssl_verify=True)\
            .filter_date(dlim=dlim)\
            .filter_resolution(ppu=ppu)\
            .filter_bounds()\
            .select(band=bands[0][0])\
            .get_images()

# Process and show an image
img = je.ImageProcess(data)\
            .calc_temporal_stats("max")\
            .show_images()
所感
ツールとしてはmatplotlibみたいな感覚で操作できるので、使いやすかったです。ただ使えるデータセットが少ない気がします....
参考文献
データ提供サービス「JAXA Earth API」のプロトタイプ版を公開開始! – JAXA 第一宇宙技術部門 Earth-graphy